
Capital Efficiency in Seaside: A Financial Model for Building Wealth through Smart Development
Why you should work with Us for all Your Real Estate Needs

Capital Efficiency in Seaside: A Financial Model for Building Wealth through Smart Development
By The Jabbour Luxury Group
Trusted Advisors in Luxury Real Estate along 30A
Executive Summary
This white paper introduces a disciplined financial model for high-end residential redevelopment in Seaside, Florida. It examines three sequential investment strategies for luxury homebuilding: the foundational capital deployment model, a staggered construction cash flow variant, and a presale-enhanced model that integrates buyer deposits. We evaluate each method using return-on-investment metrics, cash flow dynamics, and actual time-weighted capital at risk. The conclusion reveals how capital timing and presale structuring dramatically influence the true economic yield for the builder.
Section 1: Baseline Development Model
What if the numbers are provable? What if you can buy a property in Seaside for the lot purchase price shown below? We begin with a straightforward all-cash investment in Seaside:
Lot Purchase: $2,717,567 in Month 0
Build Cost: $2,200,000 paid upfront
Net Sale Proceeds: $6,638,720 in Month 24 (after agency fees)
Total investment = $4,917,567
Profit = $1,721,153
Nominal return = 35%
Annualized return (CAGR) over 24 months = 16.2%
This foundational case assumes full capital exposure from day one, with no intermediate cash inflows. This is probably a worthwhile effort for many.
Section 2: Staggered Construction Cash Flow
In practice, construction payments are phased. This section models phased costs so the rate of return is modestly better:
$2,717,567 land purchase in Month 0
$250,000 initial construction draw in Month 7
$1,950,000 paid in equal installments ($121,875) across Months 8–23
Net sale proceeds remain $6,638,720 in Month 24
With this staged deployment, internal rate of return (IRR) improves slightly:
Annualized IRR: 16.6%
Although profit remains identical, delayed capital use reduces time-weighted exposure and increases return efficiency. What does this mean? Still a worth while return to create a new home and present it back to the market on an annualized basis.
Section 3: Presale Model with Buyer Deposits
So what if you get a presale or an early sale on a property here?
Now we examine the effect of presale deposits:
Buyer deposits received:
Month 10: $250,000
Month 13: $200,000
Month 15: $200,000
Month 18: $650,000
These reduce the builder's out-of-pocket capital needs
Although IRR analysis calculates a 40.98% annualized return, this assumes theoretical reinvestment of intermediate cash flows. A more grounded metric is:
Return on Weighted Average Capital: 55.0% over 24 months
Annualized Real Return: 23.3% CAGR
This metric better reflects the actual profitability of the builder’s committed capital, taking into account capital relief from buyer participation. This is a very sound financial proposition if it was indeed a true outcome.
Section 4: Family Legacy Over Financial Maximization
But not every Seaside buyer is building purely for profit. For many, the goal is to create a lasting family legacy—a place where generations gather, grow, and return. In that case, maximizing IRR may be less important than making a sound investment that also nurtures meaning. In these cases, having a positive return for the effort might be just enough.
If you're willing to accept a lower nominal return in exchange for building those memories, how much can you afford to pay for the lot or teardown property?
Let’s assume some variables remains the same:
Total Build Cost: $2,200,000
Project Duration: 24 months
Net Sale Proceeds: $6,638,720 (after agency fees)
We reverse-engineer the allowable land acquisition cost (“L”) using various return thresholds:
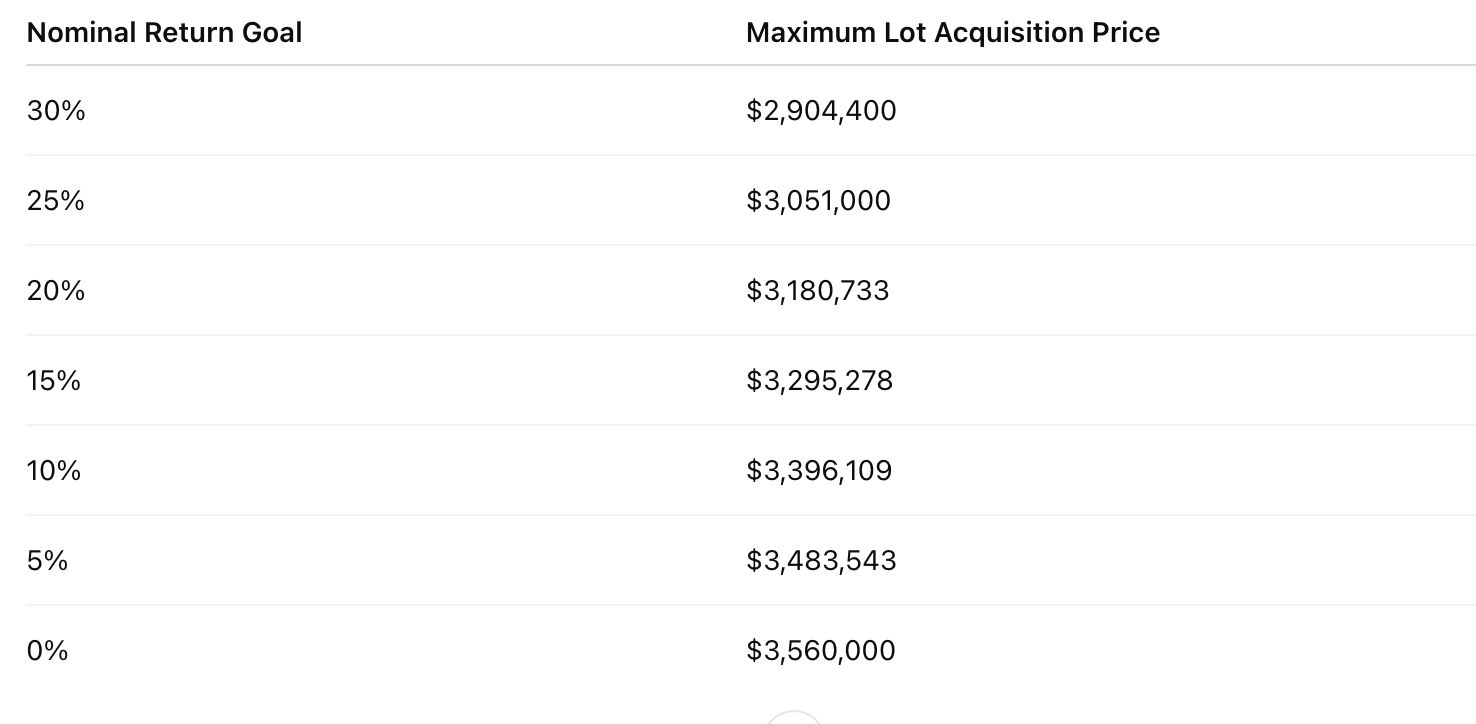
As the required return decreases, your budget for the land increases. If your intention is long-term use, lifestyle quality, and generational value—not flipping—then this model offers clarity on how to enter the market wisely. This model is what will renew Seaside over the coming years. Do you doubt these metrics? As an economist the numbers hold….but as a realtor, do the values hold? (HINT:Do Not Think they Do Not and if you call me I can prove it)
Cash Flow Table
Here is the cash flow table that gets us back into an builder mindset and a possible presale of a home under construction or to be built.
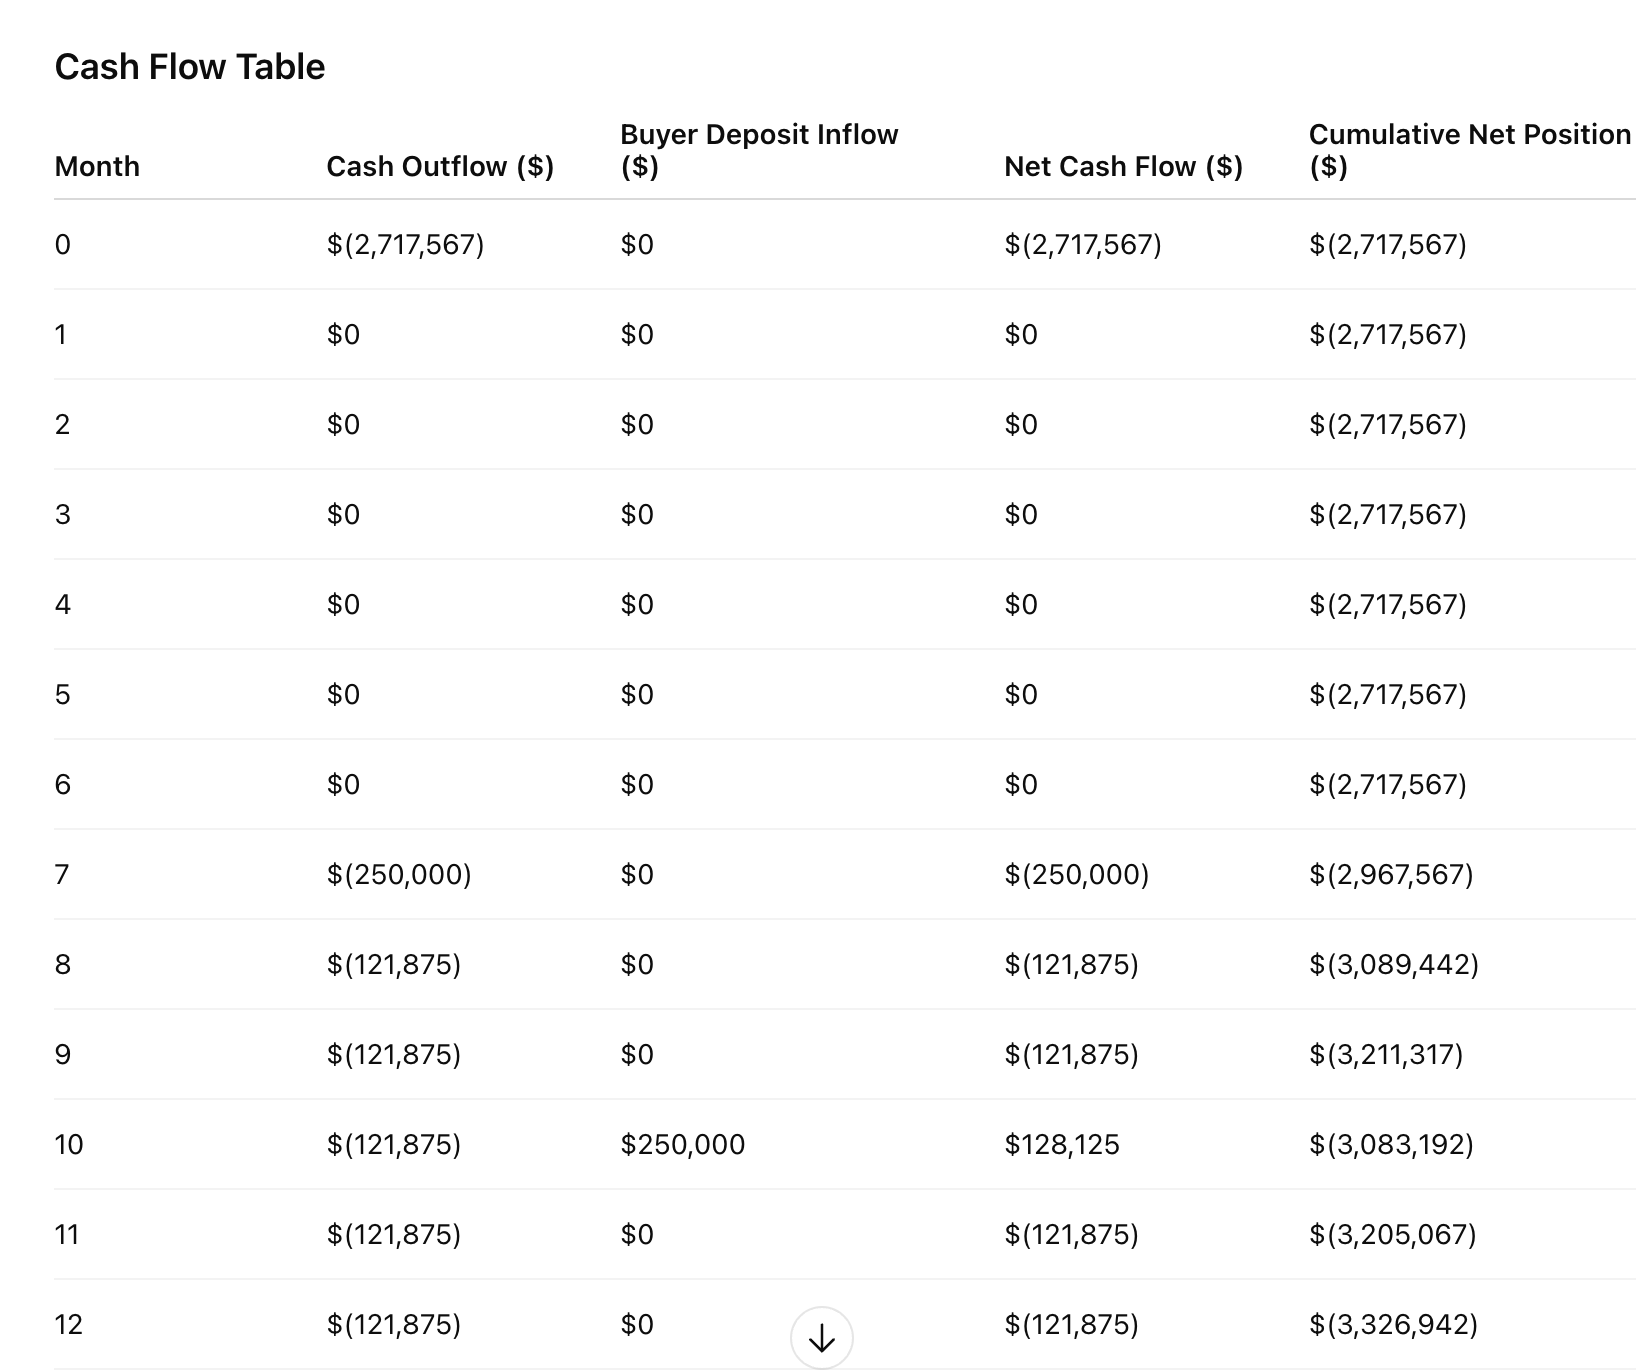
Visual Support
This chart illustrates month-by-month capital movements, including land acquisition, construction spend, buyer deposits, and the final inflow at exit. The final cash position and profit are shown distinctly to highlight the efficiency of the model when a presale is involved.

The graph helps visualize capital exposure as it evolves across the project lifecycle. The early flat section represents land-only risk. As construction begins, cash outflows increase but are partially offset by presale deposits. The closing inflow brings the entire investment cycle into profitability.
Conclusion
The Seaside redevelopment opportunity is not just about design and architecture. It is a play in capital timing, structured exits, and disciplined deployment. With presales and staged build strategies, the same $1.7M profit can yield:
16.2% annually if fully funded Day 0
16.6% with construction phase timing
23.3% annualized return on weighted capital if buyer deposits are secured
OR MORE IMPORTANTLY - A Family Legacy with economic soundness
The Jabbour Luxury Group combines boots-on-the-ground build experience with financial modeling expertise to guide you through projects like this with purpose and precision. Welcome to the beginning of the next 40 years of Seaside, Florida with the proof in the pudding.
The Jabbour Luxury Group
Strategy. Structure. Seaside.