
Capital Efficiency in Seaside: A Financial Model for Building Wealth through Smart Development PART II - Leverage
But What About Leverage? Leverage is more like Jenga.

By Richard Jabbour - The Jabbour Luxury Group
Trusted Advisors in Luxury Real Estate along 30A
Executive Summary
This white paper presents a disciplined financial model for high-end residential redevelopment in Seaside, Florida. It examines three sequential investment strategies for luxury homebuilding: a foundational capital deployment model, a staggered construction cash flow approach, and a presale-enhanced model that integrates buyer deposits.
We then layer in financing—modeling a 20% equity contribution from the builder, with the remaining 80% financed at 6.5% interest-only, paid monthly. The revised returns reflect both real cash outlays and the carrying cost of debt.
Will you get 6.5% interest-only on a construction-to-perm loan? Maybe not… maybe so. But to illustrate leverage's effect, this example holds. Leverage is more like Jenga—powerful, but delicate. Building with all cash can reduce financial volatility, especially when real estate already comprises a significant share of your portfolio.
For rental property builders, all-cash construction often makes more sense—minimizing hard costs and maximizing ROI. Ultimately, leverage is about peace of mind, portfolio mix, and beliefs. Not to put too fine a point on it—it’s also about how much cash you really have. For many, putting $5,000,000 into a Seaside build over 24 months represents too large a slice of their net worth.
So take this for what it is: an academic model, yes—but also a tool to reflect on not just the math, but the mindset of building.
Section 1: Baseline Development Model (With Financing)
We begin with a straightforward investment in Seaside using 20% equity and 80% leverage:
Lot Purchase: $2,717,567 in Month 0
Builder equity: $543,513
Financed: $2,174,054
Build Cost: $2,200,000 paid upfront in Month 1
Builder equity: $440,000
Financed: $1,760,000
Total Equity Deployed: $983,513
Interest Cost: $257,324 over 24 months (on declining balance, interest-only)
Net Sale Proceeds: $6,638,720 in Month 24 (after agency fees)
Total outlay (cash + interest) = $983,513 (equity) + $257,324 (interest) = $1,240,837
Profit (net of interest) = $6,638,720 - $4,917,567 - $257,324 = $1,463,829
Nominal return on equity = 149%
Annualized return (CAGR) over 24 months = 53.7%
Financing magnifies equity returns while introducing carrying costs. This model assumes the builder pays interest-only each month without principal reduction.
Section 2: Staggered Construction Cash Flow (With Financing)
Here, we model:
Lot Purchase: Month 0
Builder equity: $543,513
Financed: $2,174,054
Construction Draws:
Month 7: $250,000 (equity: $50,000, loan: $200,000)
Months 8–23: $121,875/month (equity: $24,375, loan: $97,500)
Total builder equity deployed gradually: $983,513 across 24 months
Interest Cost (on average balance): $214,682
Net Sale Proceeds: $6,638,720
Profit: $6,638,720 - $4,917,567 - $214,682 = $1,506,471
Nominal Return on Equity: 153.2%
Annualized Return (CAGR): 55.4%
This scenario preserves the same profit margin but delays equity deployment, minimizing capital at risk over time and reducing total interest costs.
Section 3: Presale Model with Buyer Deposits (With Financing)
We now add buyer deposits to the staggered draw schedule, further offsetting the builder’s cash exposure:
Buyer deposits:
Month 10: $250,000
Month 13: $200,000
Month 15: $200,000
Month 18: $650,000
These inflows reduce loan balances and interest accruals month-to-month.
Builder equity required: ~$983,513
Total interest paid: $169,927
Net sale proceeds: $6,638,720
Profit: $6,638,720 - $4,917,567 - $169,927 = $1,551,226
Nominal Return on Equity: 157.6%
Annualized Return (CAGR): 57.6%
This scenario shows how presales can reduce both equity and debt needs, optimizing total cost of capital while preserving profit.
Section 4: Family Legacy Over Financial Maximization (With Financing)
Not every Seaside buyer is building purely for profit. For many, the goal is to create a lasting family legacy—a place where generations gather, grow, and return. In that case, maximizing IRR may be less important than making a sound investment that also nurtures meaning.
If you're willing to accept a lower nominal return in exchange for building those memories, how much can you afford to pay for the lot or teardown property? The real question is does this leverage model apply? Maybe. If a builder has confidence in a presale in Seaside, which is easier to achieve than in some areas, then he may look at lower starting nominal returns because of the return on equity IRR. So for a family this may not apply so much…but a building on leverage is likely to take less than 35% nominal return, particularly if while planning there is a home on the property that is renting. In Seaside that is the case and some of those homes, pet friendly, rent very well while you wait.
Let’s assume:
Total build cost: $2,200,000 (still 20% equity, 80% loan)
Project duration: 24 months
Exit proceeds: $6,638,720 (net of agency costs)
We solve for the allowable land acquisition price that achieves varying return thresholds on equity:
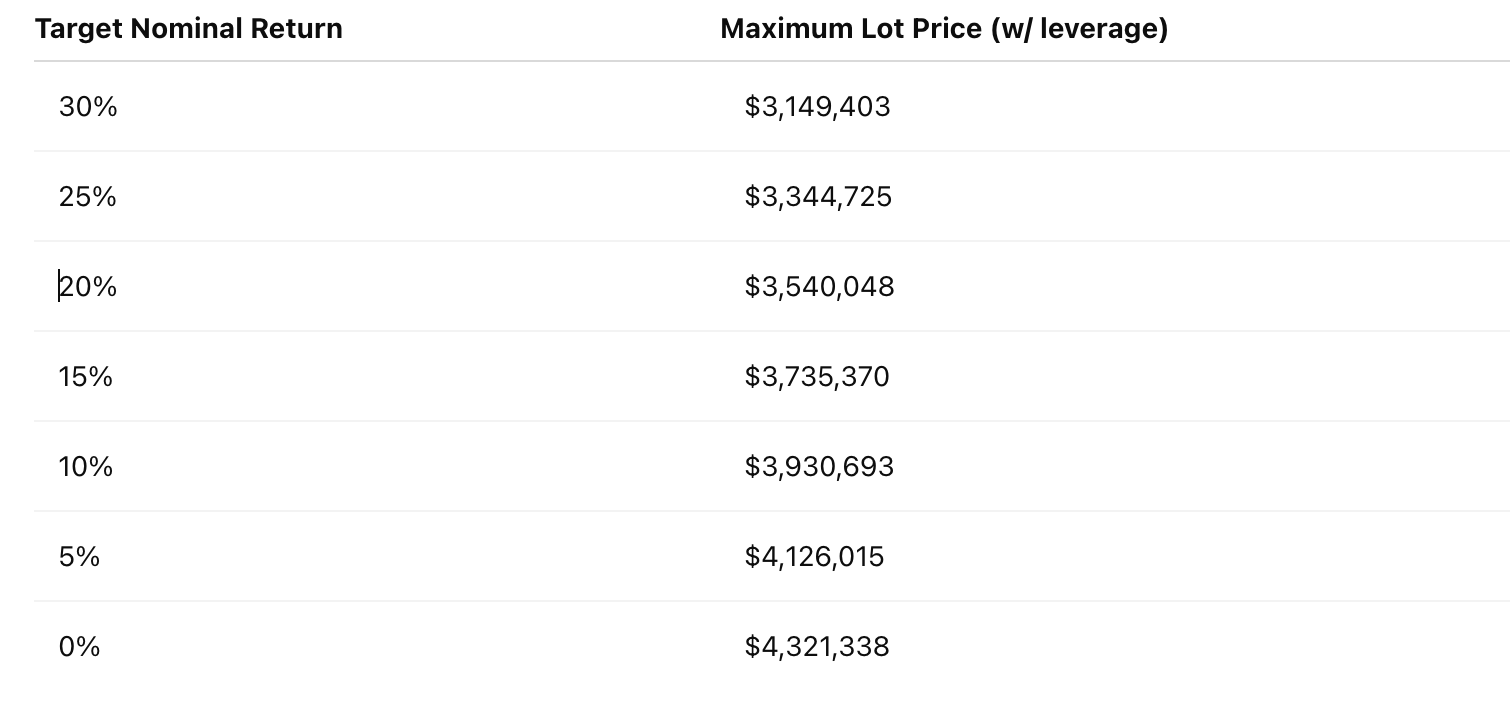
As the required return decreases, your budget for land increases. If your intention is long-term use, lifestyle quality, and generational value—not flipping—then this model offers clarity on how to enter the market wisely while still applying disciplined financial thinking.
Conclusion
The Seaside redevelopment opportunity is not just about design and architecture. It is a play in capital timing, structured exits, disciplined deployment, and strategic use of leverage. With presales and financing:
53.7% annualized return if fully funded and leveraged Day 0
55.4% if construction is phased
57.6% if buyer deposits are secured
⚠️ However, these returns must be interpreted properly.
To evaluate builder profit accurately, we must recognize that:
Buyer deposits reduce loan balances and interest, but are not additional profit.
Net cash position at project end reflects all flows, not free profit.
True profit remains:
Net sale proceeds ($6,638,720)
Minus Land + Build Costs ($4,917,567)
Minus Interest Paid ($169,927–$257,324 depending on scenario)
Maximum achievable profit = $1,721,153 (unleveraged gross profit) Leverage and timing optimize the return on equity—not total project profit.
Still, there are life choices in all of this.
Yes—leverage boosts IRR percentages. But it does not increase total profit. The nominal dollar return remains fixed:
Selling Proceeds – Land Cost – Build Cost = Maximum Profit
Leverage simply reduces the equity required to earn that profit—and that can be meaningful. Especially with a presale, equity can drop dramatically while returns on that equity skyrocket.
But no strategy is without risk.
If you like sleeping at night knowing you can 1) Rent it, 2) Sell it, or 3) Live in it—no matter how long it takes—then leverage could keep you up if that buyer doesn’t show. And if the sale price softens too far…
You get the idea.
The Jabbour Luxury Group combines boots-on-the-ground build experience with financial modeling expertise to guide you through projects like this with purpose and precision.
Richard Jabbour - The Jabbour Luxury Group
Strategy. Structure. Seaside.