
Introduction: Understanding Value Beyond the Math
In Costa Rica they just Don't Yet Get it.

The fallback position of real estate valuation has almost forever been pricing per square anything. Meters feet or any other item is the common thinking. The real estate professionals that look at valuation the way it should be determined sometimes are dismissed early, but valuation of real estate and successful consistent performance in pricing prediction is a marathon and not a sprint. Pricing a home correctly is a process of price band evaluation for broad market competition, local market evaluation for local competition and then specific home evaluation for condition fit and finish.
The measure of pricing performance effectiveness commonly used in our United States practice, which can be measured here as well is a real estate professional’s sales price to original list price ratio at closing.
Our team for 11 years has evaluated home pricing as “appraisals” which is a much more complex form of value determination. Further we have followed our own suggestions of pricing so we can measure the model’s performance. But measurement one way is not important if it is not measured against a control measure. The control measure is pricing per square foot averages. We have historically evaluated that difference and it is meaningful.
While beyond this update’s purpose, suffice it to say pricing per square foot sales data is rather easy to demonstrate as statistically insignificant. How? Remember statistics in High School or College? Remember the graph where you would have a lot of dots and then a line going through them and you called that the best fit line? Remember the R Squared measure which was the measure of how well the SINGLE factor of the line predicted outcomes? I am an economist by trade and shortcuts have never been my style. We used predictive statistical analysis to determine likely selling prices of homes and that method over 11 years has proven to be about 95% accurate within 2%. Admittedly in times of flux like the extraordinary rise in the market during the global unsustainable pandemic market the model lagged upside pricing momentum for a time.
Price per square meter, square foot, or bedroom count may look precise — but they’re fallout statistics: traces of decisions already made, not the forces that created them. They describe history, not intention. Comparing 3-bedroom homes to other 3-bedroom homes may appear more predictive, but it simply controls for one more variable — bedroom count. Even then, the single-factor model remains shallow; isolating one variable only reveals its limited additive influence. True valuation requires examining how multiple factors interact, not assuming one metric can explain them all. Indeed, by limiting the sample size, small sample bias enters the model and a false sense of model accuracy sets in. If two homes have sold the fit line between them will be 100% accurate. I leave the rest to the reader to understand statistics and small sample bias.
So, in a study of a range of homes of varying bedrooms and size and even prices, the model may not fit very well. When the data is reduced to just 4 bedrooms or a certain age of home range or some other single objective factor, the fit of the data will likely look objectively better. Why? In statistics as you reduce data you introduce small sample bias. However, the additive effect of both items together is measurably better. Two factor or more modeling is beyond the scope of this tutorial, but we use our pricing methods to isolate other important factors. Still, using math, a predictive model vs. a simple average or pricing per square X will produce widely different results. This is a mathematical reality of science when evaluating pricing prediction in any market. Multifactor or single factor models are always going to predict outcomes while averages may not.
Real value and proper pricing are born from confidence in liquidity, cohesion in a community, and the emotional architecture of a place long before it shows up in a spreadsheet. All communities win on some scores and lose on others. These factors are not captured in simple average pricing models. They are not obviously captured in rigorous models like ours, but our model at least points out the fallacy of simple ideas of pricing. Pricing is more complex.
More important and what luxury agents do well is to understand the competitive pricing band. A purchaser of a luxury home is shopping in a pricing range. Often the typical agent asks the simple questions like “How many bedrooms do you need” or other simple metrics. That is a method of sales for sure, but it is not the only way to understand a buyer’s wants. We have often encountered people that would have otherwise had simple requests of budget, beds, bath and size only to end up with something that does not even come close to that metric description. “I want a large yard” might just as easily translate to a postage stamp lot and the back yard that is immediately on the 18th fairway at a golf course. Descriptions of metrics are feelings boiled down to the easiest way to express them to the lowest common denominator of a discussion.
The next consideration is the more micro economic market of a local community. We turn to the real measures of health.
Absorption is the Feeling Indicator – Where Feelings Hit Outcomes
While it is not always the easiest conversation for many, those that engage in it are usually the better sellers of homes and indeed the better buyers of homes.
This measure demonstrates the health of a market along whatever factors may be driving its activity. It shows how people feel about a market. The better they feel the more quickly homes sell and the more predictable the pricing on a statistical measure.
Evaluating average pricing or pricing per square X of sales that have occurred can be rather irrelevant and misleading. If a community has had 3 sales in the last 12 months but another has had 21 all else equal, the average comparison is simply nonsense. It is highly likely that one community is more highly desirable on a range of factors.
In general, then in our practice in our luxury market we evaluate two things together to determine the health of any market or submarket, the absorption rates and the fit of the scatter plot of pricing.
As single ideas, the higher the absorption rate all else equal, the healthier the market. The lower the scattering of the dot plot (shown later) of home sales all else equal, the healthier the market. The ideal market would be a very high absorption rate (faster sales fewer days on market) and a perfect fit of size to price. The dot of a healthy market is in the upper left.

We are constantly evaluating our primary markets in this detailed way, market to market and submarket to submarket, and I felt now would be a fine time to dig into it as also a bit of an explanation of our method since more common methods are available and commonly referenced.
We feel it important to return a more rigorous academic view of pricing in real estate and have been doing that for 11 years now. Method matters. Our Sales Price to Original List Price Ratio worldwide is 98.5%.
The Las Catalinas market taken in isolation suffers from subpar absorption (not 100% complete data but directionally accurate). While there is, for all of us worldwide, general market risk in these current outcomes, there is also community specific risk we are experiencing here. It can be evaluated relatively as I did in the first release of this discussion to the group some time back introducing this set of charts and graphs.
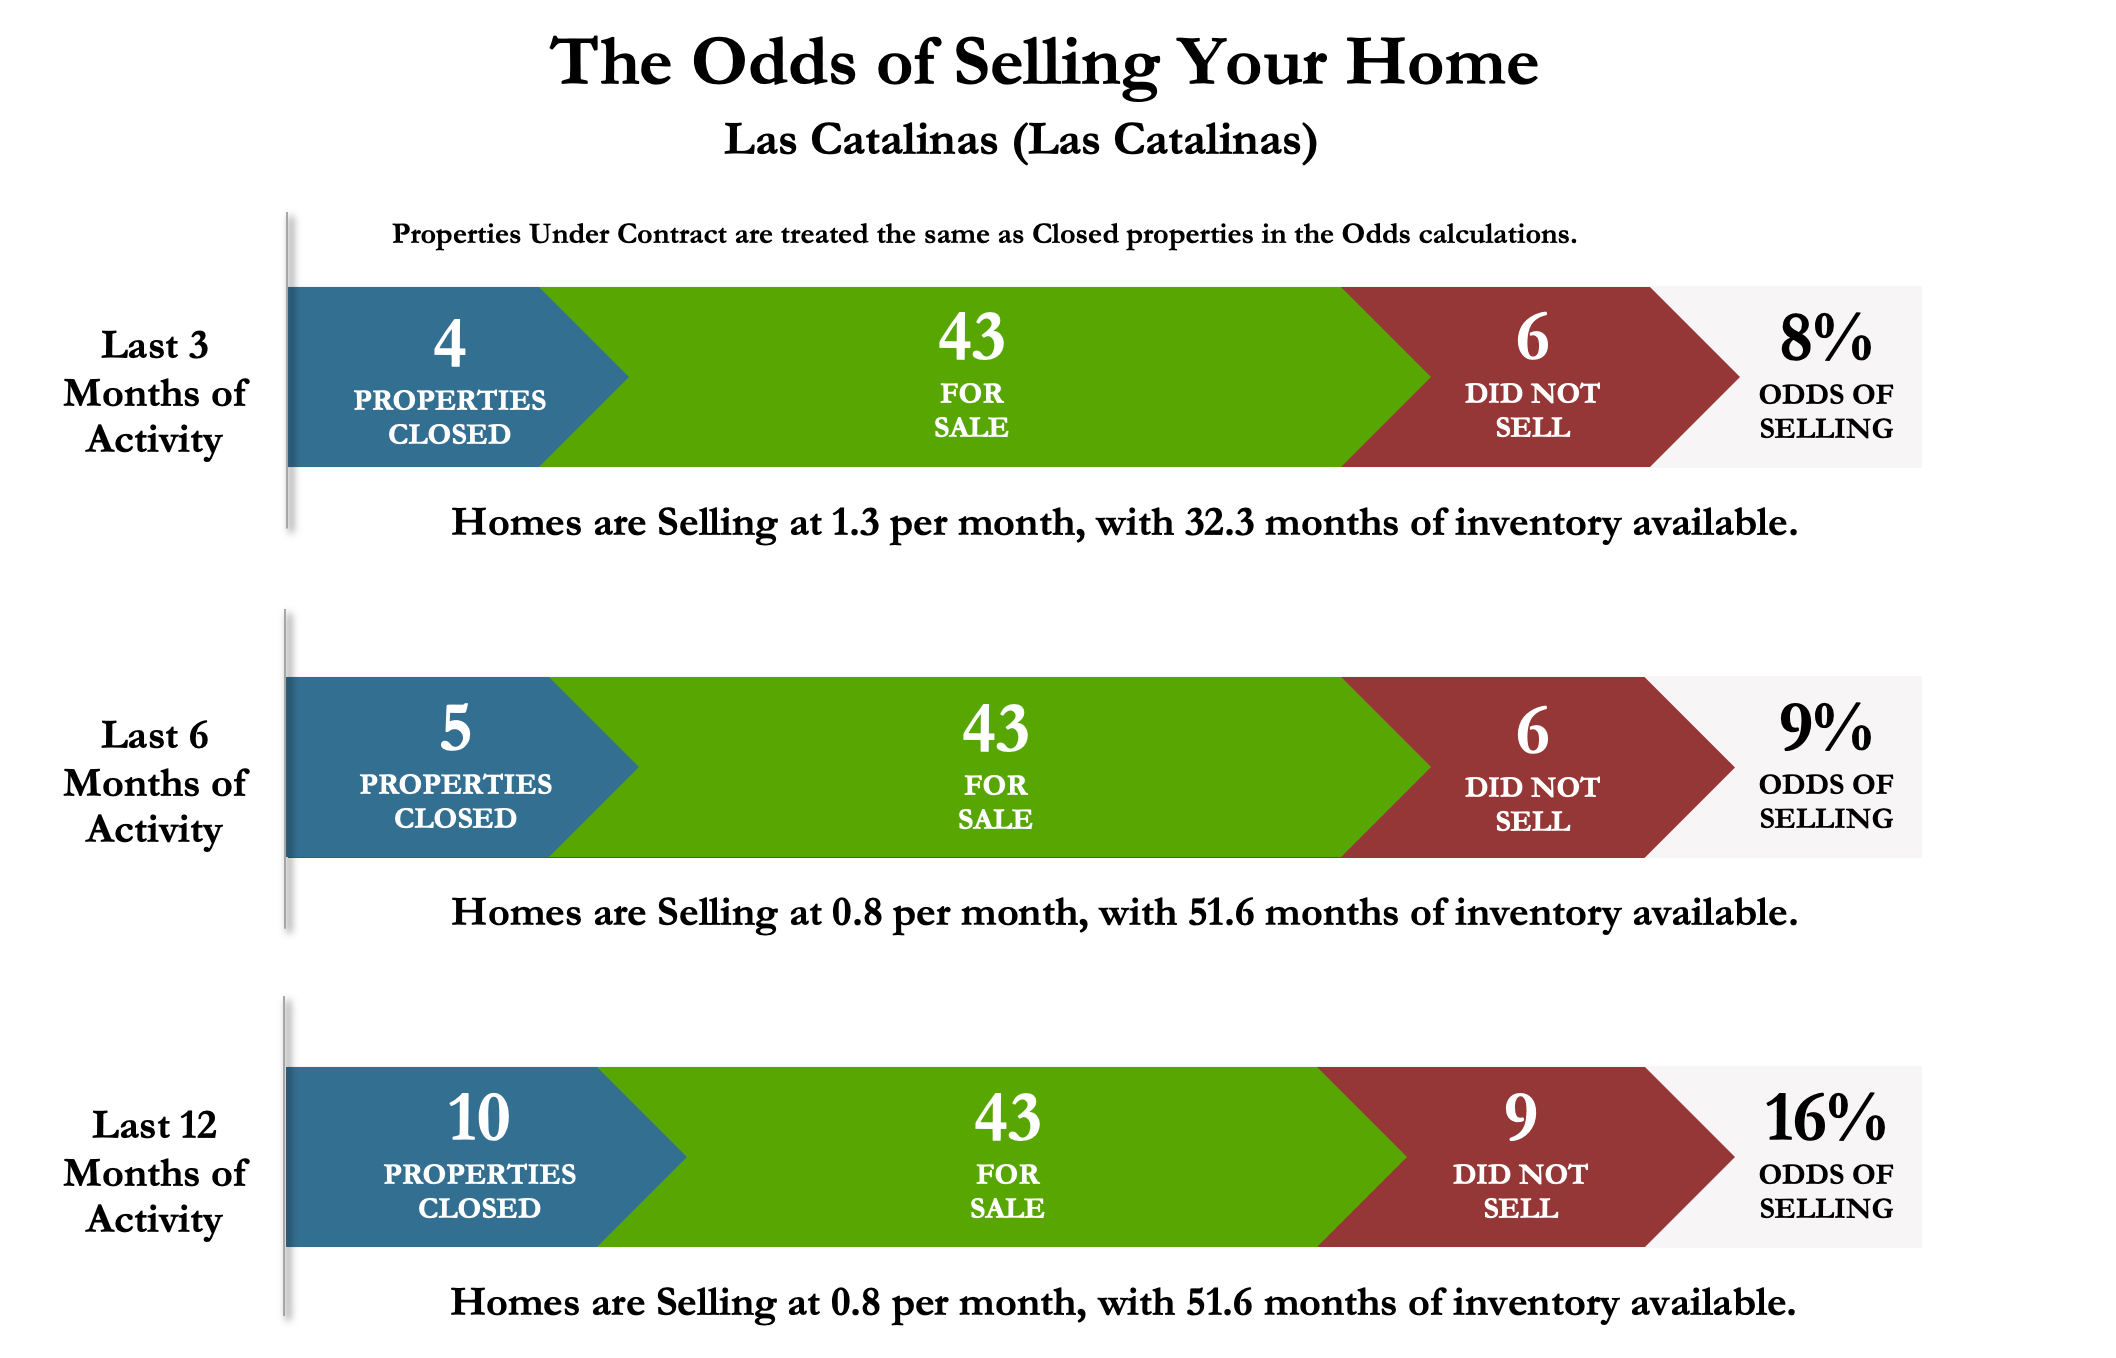
How do you know that this is not a good absorption? Costa Rica is a substantially inefficient market. It is marked by unnecessarily difficult contracting methods, weak engagement of negotiation, and “black box” processes that few seem to really challenge. This, overall, has Costa Rica Days on market easily exceeding 400 days generally. Currently Las Catalinas is around 311 Days on Market. So, compare it to what?
We can easily compare this to zones. The zones we would compare would also be relevant. Comparing this to an area of homes that average $400,000 each would be irrelevant just as comparing it to a community where homes average $7,000,000. Reserva Conchal is probably a reasonable proxy for one comparison. There are enough homes of a wide variety of similar price points and with a structure of associations not entirely dissimilar to Las Catalinas.
Reserva Conchal Absorption – Just One Comparison Control Group

This above is clearly a healthier market based on absorption alone. So, by control of some community’s vs Las Catalinas the conclusion that Las Catalinas is relatively unhealthy just based on absorption seems a plausible conclusion. How it compares to other areas on a pricing per square X measure does not reveal completely underlying health. While it may sell for more per sq X, if it is not selling does it really matter?
Market Scatter and Value Indicators – The Next Component
The next major indicator of market health is one that most practitioners overlook or simply do not understand, single factor and multifactor price modeling.
Homes are not priced per square foot or square anything and it is provable — they are sold for a total value, and the price-per-foot metric simply fallsout of that transaction.
The factors that lead to a sale are broad and layered. When we analyze a specific property, we measure the probable selling price and set the list price accordingly. But when evaluating the health of an entire market, we use the pricing scatter diagrams differently.
For those interested in the underlying statistics, the concept is simple: the more scattered the blue data points are around the red trend line, the less disciplined is market pricing (less predictable by buyers or sellers). Tight clustering indicates shared understanding between buyers and sellers — a market that “knows” its value. Wide dispersion, by contrast, signals inconsistency, speculation, and uncertainty and usually excess to the market risk.

When this scatter is paired with absorption data, the interpretation deepens.
A market can survive some scatter if absorption is strong — buyers are still confident enough to transact.
But when scatter is high and absorption is weak, confidence collapses.
The above is not very predictive, but studies in various markets have shown this is about as good as it gets for predicting pricing using a square foot or meter metric for homes in certain types of markets if the sample size is not too small. If you average the above and set pricing accordingly, a home can be mispriced by a meaningful amount and despite condition, location, micro market instability, views or other factors, the common practice is to look at pricing per square X and set it and forget it.
If pricing per square foot or meter or otherwise was predictive then pricing in any market would look like this.

Why is this important? Well, if you want to list your house it is not, but if you want to sell your house it is. Pricing correctly, will create an outcome more quickly than any social media post.
In Las Catalinas, current data shows a combination where: a bit better fit of the scatter around the trend line is paired with persistently low absorption. Together, these mark what we would describe as a nearly two-strike market — a period of imbalance where pricing signals are at least reasonably clear or seemingly so, but liquidity is constrained. The fitment below is actually pretty good. But there is something else we need to cover. Be aware, however, that an economist or statistician would view the sample size of sold homes in Beachtown and a small sample creating a higher fit than is usual. Still, it is what it is.

But then there is this. While it is difficult to track perfectly because of the unnecessary market inefficiency in Costa Rica, there is a pretty good set of historical data we have gathered from the public market of listings in Las Catalinas which has increased over time and we have tracked nonpublic listings from the time we detect them as first presented to the market. We keep up with initial pricing and then track the sales price to original list price ratio. The reason for the fitment above is as a fall out of the final sale. If we plotted original listing prices against those sales, we would find that selling prices are on average 8.94% lower that the original listing price established over the last year.
Now follow along because we can test what our model would have said vs. the actual outcome that occurred.
Going back in time in our analysis to a point before the above sales closed, we can plot the sales at that time and the “for-sale listing pricing” of the future closings. In this way we can evaluate how that pricing at the price per square X would have missed our model-based suggestion.
Our model would have suggested an 11% difference in the pricing to the downside. In other words, our model, run 1 year before the run above would have predicted. Mispricing is the single worst thing one can do when presenting real estate to the market. No one is immune from it, but some do less of it than others depending on the model predictive capability.
Said more plainly, if priced correctly from the get-go the above homes would have likely sold faster. To be clear as shown below, the green triangles are the original offering prices of the homes that sold in the previous scatter chart. You can draw your own conclusions as you map this out. But in general, as you move past the intersection of the green line and red line to the upper right, the original list pricing becomes more substantially incorrect. On average these computes to about an 11% mispricing at original listing date. Our model would have suggested that mispricing very easily as shown below.

Of course, many stick to the cliché of “leaving room in the list price to negotiate”. In the “anchoring” strategy of negotiation this is a mistake that often leads to losing other elements of the negotiation. Our group, although we do have it occur from time to time as we all do, prefers to not “leave room” in listing prices. It adds days on market, and it eventually leads to pricing reductions as it becomes clear the listing price request cannot be defended in conversations. There are multitudes of academic research papers that demonstrate that mispriced homes ultimately sell for less than they otherwise might have sold for if priced right earlier.
Average pricing per square foot as a fall out measure (or price per square meter) does not really tell a story of health. It tells the story of the patient after they have checked out of the hospital.
Conclusion
Las Catalinas is presently Stable but Stalled on our measures. The dot would be in the Lower left.
We hope this helps you to understand our conclusion of the health of the market in Las Catalinas, how we can compare it relatively to other markets for relative health, and how we view pricing as a more objective and serious undertaking.
But at the end of the day our role is to help people understand a home and what it means to them, their families and to their lives. Pricing is one thing, but connecting people to their goals that go beyond price is the real objective. Most of us continue to love the feeling of Costa Rica and we hang on to that despite the changing values of our homes.
We stand by the data, the methods and the results. Feel free to examine our history anytime. Google “the Jabbour Luxury Group” and have fun. Our approach is to economically understand the underlying health of a market objectively so we can understand how that can give insight to the overall market psychology