
#1 Reason Realtors Do Not Value Homes Properly
Episode 2: Real Data, Real Samples, Real Volatility

Recap from Episode 1
In our first piece, we explored how sample size governs stability in statistics. The larger the pool, the more resistant the numbers are to distortion by outliers. Conversely, as samples shrink, volatility escalates — each sale carries more weight, and medians become increasingly fragile.
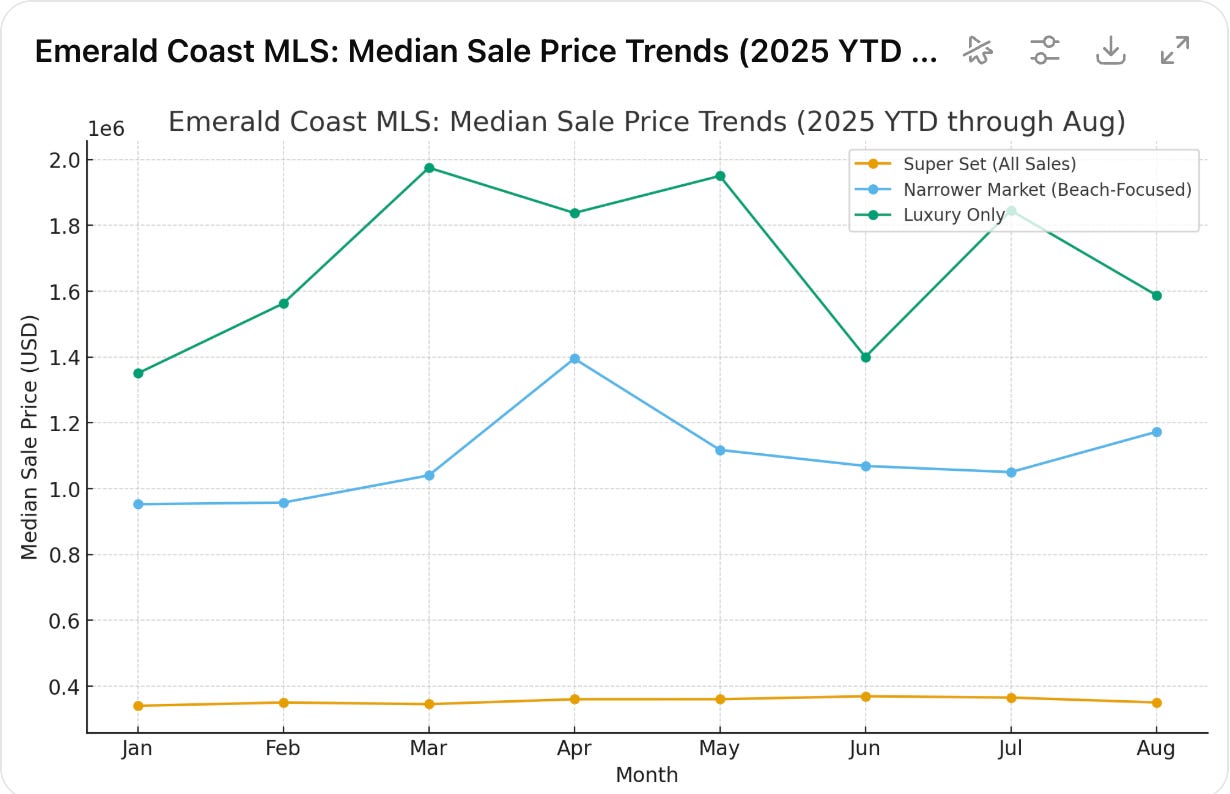
Today, we apply that framework to the Emerald Coast MLS universe of data. By moving from the broadest pool of all sales (the Super Set), to a beach-focused discretionary submarket (the Narrower Market), to the high-end coastal trades (the Luxury Tier), we can see in real time how volatility grows as sample size contracts.
The academic point remains the same: sample size determines not only how much the data can be trusted, but also how it must be interpreted.
The Super Set: Broad Stability
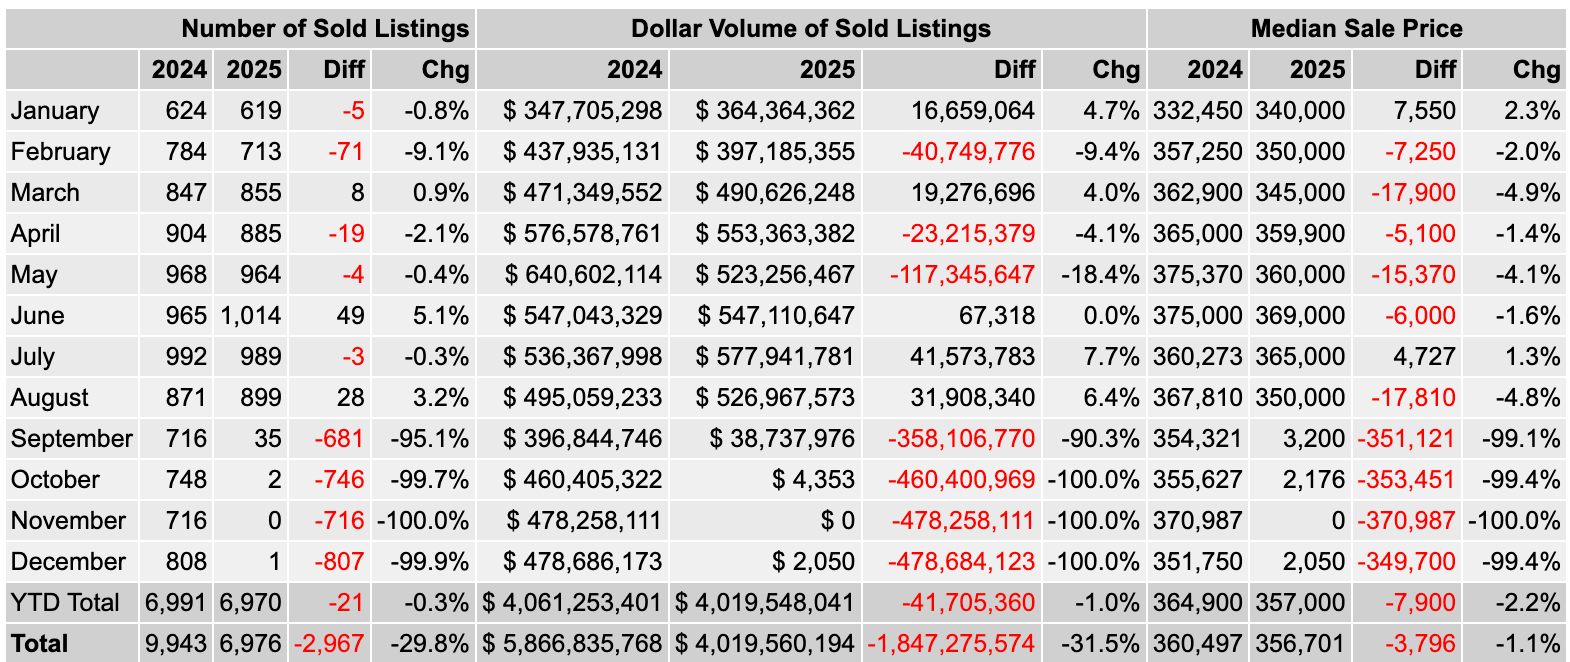
At the level of the full MLS, the dataset is massive — nearly 7,000 closings YTD. Here the law of large numbers smooths volatility. Month-to-month medians move modestly: up 2.3 percent in January, down 4.9 percent in March, barely perceptible when viewed against the backdrop of thousands of transactions.
The YTD median stands at $357,000, a decline of –2.2 percent compared with 2024. This figure is not dramatic, but it is statistically stable. It captures the “tide” of the Emerald Coast housing market, not the ripples of individual waves.
Closings YTD: ~7,000
YTD Median: $357,000 (–2.2%)
Volatility Profile: Low; broad stability dominates
📉 Super Set: stable, representative, modestly lower
The Narrower Beach Market: Volatility Emerges
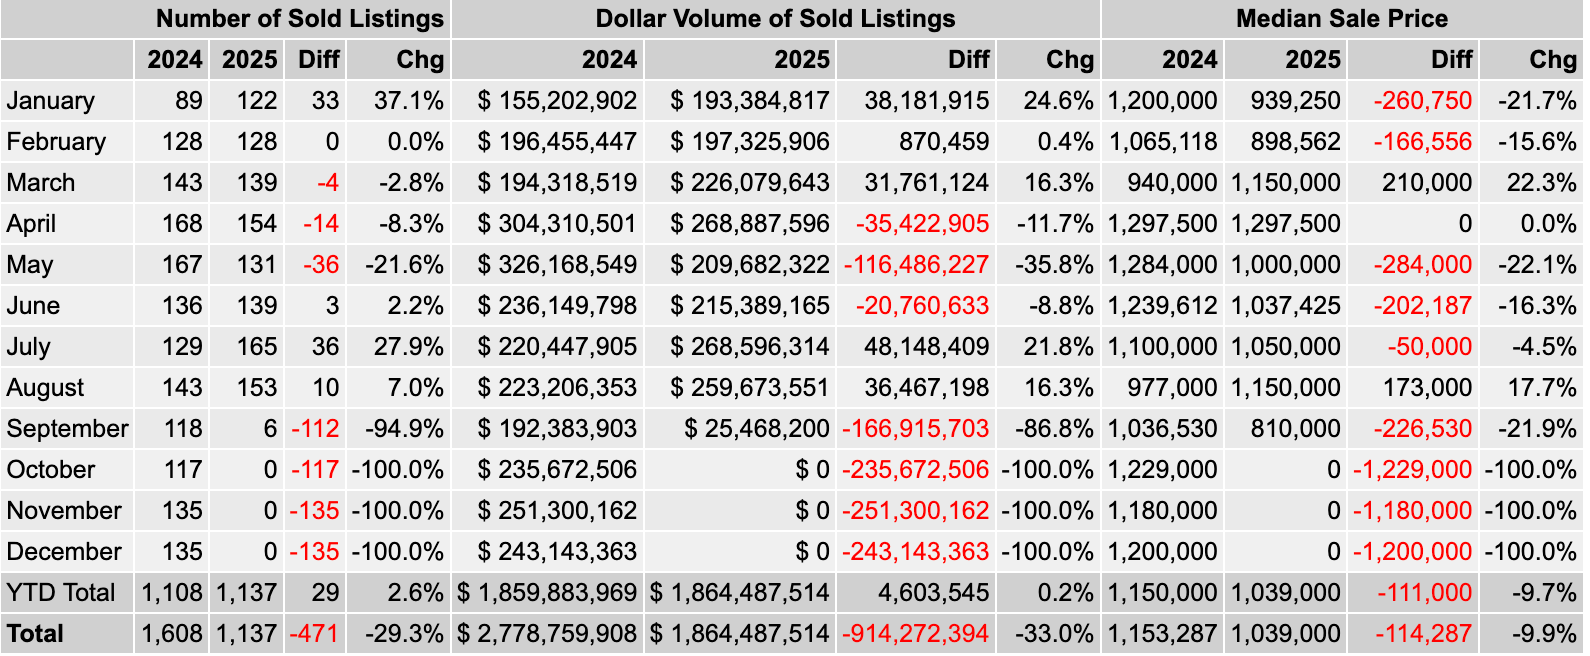
When we shrink the aperture to the discretionary beach markets, annual closings drop to fewer than 1,000. Now volatility begins to show its teeth. In January, the median fell –20.6 percent year-over-year. By March, it had surged +18.9 percent. By May, it dropped again –17.1 percent.
This is not irrational buyer behavior; it is the arithmetic of smaller samples. A few clustered high-end closings in March pushed the median up, while the absence of such trades in May pulled it down. By year-to-date, the median has settled at $1.075 million, a decline of –10.0 percent.
Narratively, this dataset teaches us that discretionary demand magnifies volatility. Statistically, it illustrates why smaller samples should be interpreted with caution.
Closings YTD: ~950
YTD Median: $1.075M (–10.0%)
Volatility Profile: Moderate-to-high; swings driven by transaction mix
📉 Narrower Market: volatile, discretionary, trending lower
The Luxury Tier: Volatility Becomes Distortion
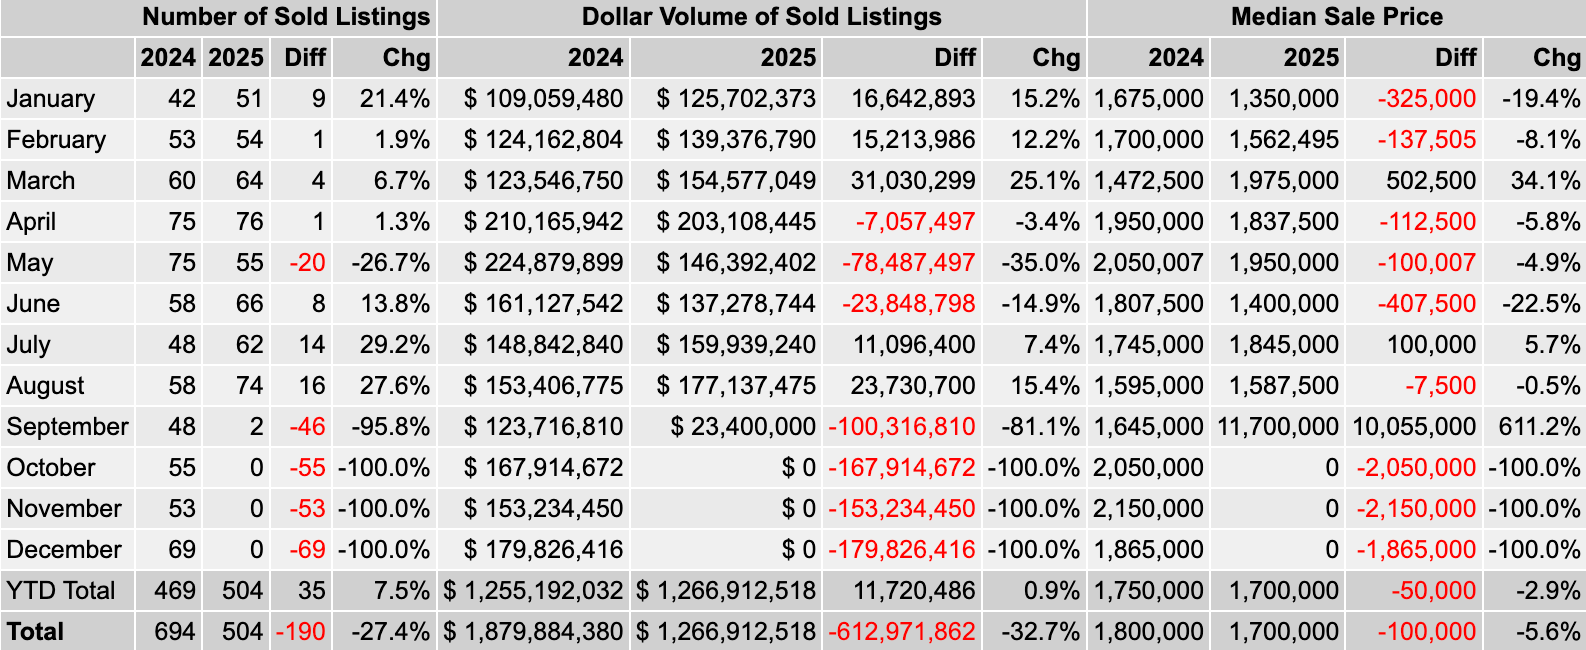
The most constrained dataset — the luxury-only segment — records only about 500 closings YTD, sometimes fewer than 60 per month. Under these conditions, volatility mutates into distortion.
In March, a series of $4M closings lifted the median +34 percent.
In June, the absence of such sales pulled the median down –22 percent.
In September, so far only two closings have occurred — one at $11M — sending the median up +611 percent. This will moderate OF COURSE but you get the point. It is a small sample right now.
These gyrations are statistical artifacts, not market reality. The true YTD median for luxury sales is $1.70 million, down –2.9 percent from last year. But month-to-month readings are misleading to the point of uselessness unless smoothed or contextualized.
This is the purest form of the Episode 1 lesson: as samples shrink, volatility expands exponentially. In luxury, medians often describe nothing more than the mix of properties that happened to close that month.
Closings YTD: ~500
YTD Median: $1.70M (–2.9%)
Volatility Profile: Extreme; medians shaped by individual transactions
📉 Luxury: lumpy, fragile, and misleading without context
The Common Thread
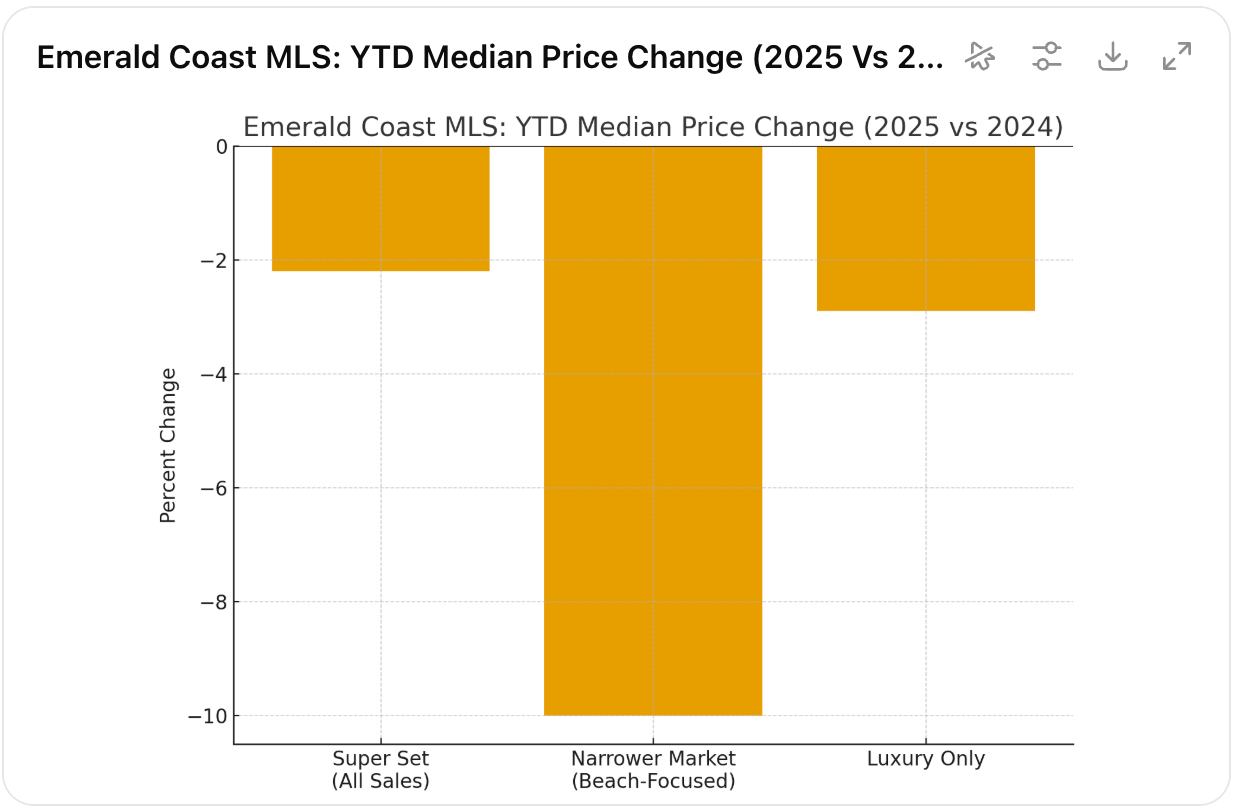
Although the volatility varies by sample size, the directional outcome is the same: medians are down year-to-date.
Super Set: –2.2%
Narrower Market: –9.7%
Luxury Tier: –2.9%
This is the research point that transcends the statistics. Volatility can obscure, but it does not erase the underlying reality. Whether measured across 7,000 homes, 950 homes, or 500 homes, the Emerald Coast MLS points in the same direction: 2025 medians are lower than 2024.
Why This Matters
The Emerald Coast is a market defined by discretionary demand and punctuated by luxury trades. That composition makes it particularly vulnerable to statistical distortion. But the lesson is universal:
Large samples (Super Set) provide stability and reliability.
Medium samples (Narrower Market) are volatile but reveal the ebb and flow of discretionary demand.
Small samples (Luxury) exaggerate volatility to the point where context is essential for any useful interpretation.
The practical risk is clear. Realtors who pluck a single month’s luxury median and pronounce the market “up 600 percent” are not describing market truth. They are mistaking noise for signal. Buyers and sellers who act on such numbers risk misjudging value and timing.
Closing Thought
What began in Episode 1 as a lesson in statistical theory — the law of large and small numbers — here becomes a practical tool for interpreting the Emerald Coast housing market. The ripples are noisy, sometimes violently so, but the tide is clear: across every sample, medians are down.
The skill lies in seeing through volatility, not being fooled by it. That is the difference between reading the data as a marketer and reading it as a researcher.