
Old Seagrove Economics: The Myth of the Investor vs. the Cowboy
Economics is in the Red Zone and a Touchdown is near

The Premise
Old Seagrove is one of 30A’s most distinctive enclaves — 50x100 lots, a few larger near the beach with really good views and many larger ones that will not have a view further away — and a blend of original cottages and high-design new builds that define today’s market trajectory. As the leading re-developer in this area, we’ve had a front-row seat to how the real economics play out versus what sellers tend to believe and cling to.
The Baseline Sale
A recent sale of a 5,100 sq. ft. home closed at $5,169,000, fully furnished, with an above-average Gulf view and premium finishes. The home was contracted before completion, which speaks to the demand for well-designed, move-in-ready product.
The all-in build cost was $2,594,000 plus $169,000 in furnishings, for a total investment of $2,763,000. Factoring in 5% agency commission and 0.7% Walton County stamp tax, we can work backward to understand the underlying economics. Economics gets behind by a touchdown or two but at the final horn it is always the winner. We can talk about that anytime. As a trained economist I do think I have some insight here. We track data too.
The Framework
We are not looking at this through the lens of leverage, financing, or speculative emotion. The market only deals with the economics of activity not the ego of it. I am sure like the next person I too would like to say I got a 78% return building a home because of the use of leverage. But the home is only going to yield the nominal dollar return it will yield. The market does not pay you for your financing choices.
This is a cash-based economic reality check — the difference between being an investor and being a cowboy.
Leverage distorts understanding. Cash reveals truth. We’re talking about what a property is worth — not what someone can temporarily afford to overpay for with cheap credit or leverage a build to limit deployed capital to goose ROI.
The Cold Hard Math
For this illustration the sale price is fixed at $5,169,000. After 5% agency commission and 0.7% stamp tax, the net sale proceeds are:
Net Sale Proceeds = $5,169,000 × (1 − 0.05 − 0.007) = $4,874,367
Build + Contractor fee (important later) + furnishings are fixed at $2,763,000. For a two‑year project, the residual lot value (what an investor can pay for the dirt) that still achieves the required **annualized return **r is:
Residual Lot Value = Net Sale Proceeds / (1 + r)^2 − Build&Furnish Cost
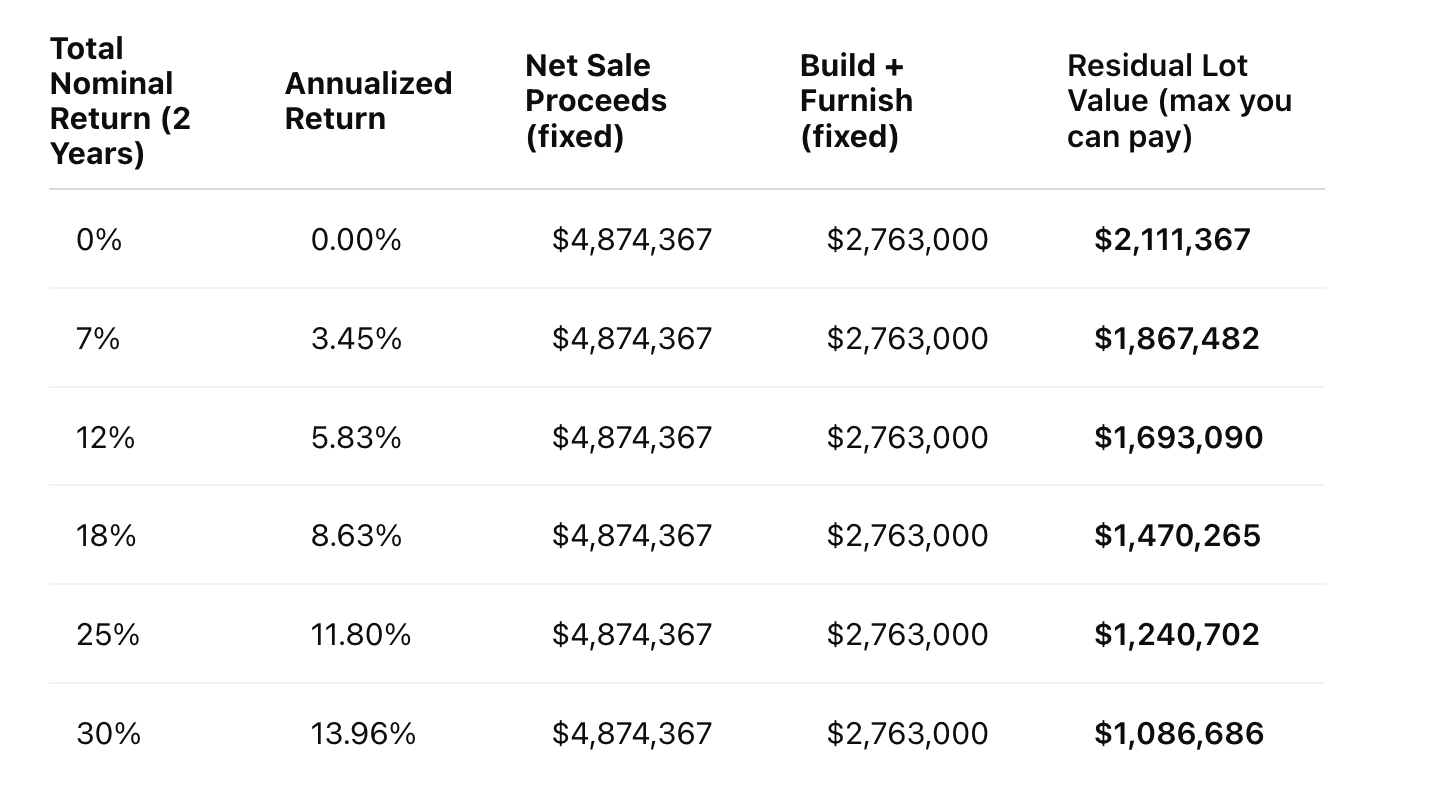
Who the Hell Would Do 0%, 7%, 12%, 18%, 25%, or 30%?
0% Return: The sentimental homeowner. The “I just want to live here” crowd. This is lifestyle-driven, not economically rational.
7% Return: The cautious renovator or second-home buyer telling themselves they’ll “break even” after enjoyment. They are occupiers with upside, not true investors.
12% Return: The disciplined small developer. Knows their numbers, values time and capital, and accepts moderate risk for solid reward.
18% Return: The professional builder-operator. Understands execution risk, carries overhead, and expects market cycles. This is sustainable for professional redevelopers like us.
25% Return: The opportunist or contrarian who buys mispriced land, times cycles perfectly, and takes calculated—but rare—shots. These projects exist, but they’re few and far between.
30% Return: The rare market outlier — exceptional timing, unique lot, or unusual value creation. Usually luck, inside knowledge, or the early bird catching the next trend.
The Cowboy Capitalist and the Mirage of Leverage
For the leverage illustration, we’re now using the 25% nominal return case as the benchmark — that one implied a land basis of $1,240,702, the figure that most closely aligns with a motivated Capital investor builder who’s confident in their ability to execute efficiently. But this is not THE builder. This person is paying a contractor fee embedded in our numbers.
That gives us a realistic total project cost:
Build + Furnish: $2,763,000
Land: $1,240,702
Total Cost (including land): $4,003,702
With net sale proceeds fixed at $4,874,367, the nominal profit (2-year) becomes:
Profit = $4,874,367 − $4,003,702 = $870,665
Now — leverage doesn’t change dollars of profit; it changes the equity required, which changes the annualized return on equity (optics). Below we apply financing as a percent of total cost (including land) and compute the resulting annualized return on cash invested over two years (no timing or interest modeled here — deliberately simplified to show the optical effect only - It is a fair bit more subtle when you consider the timing of cash flow and the returns are actually modestly higher in all cases).
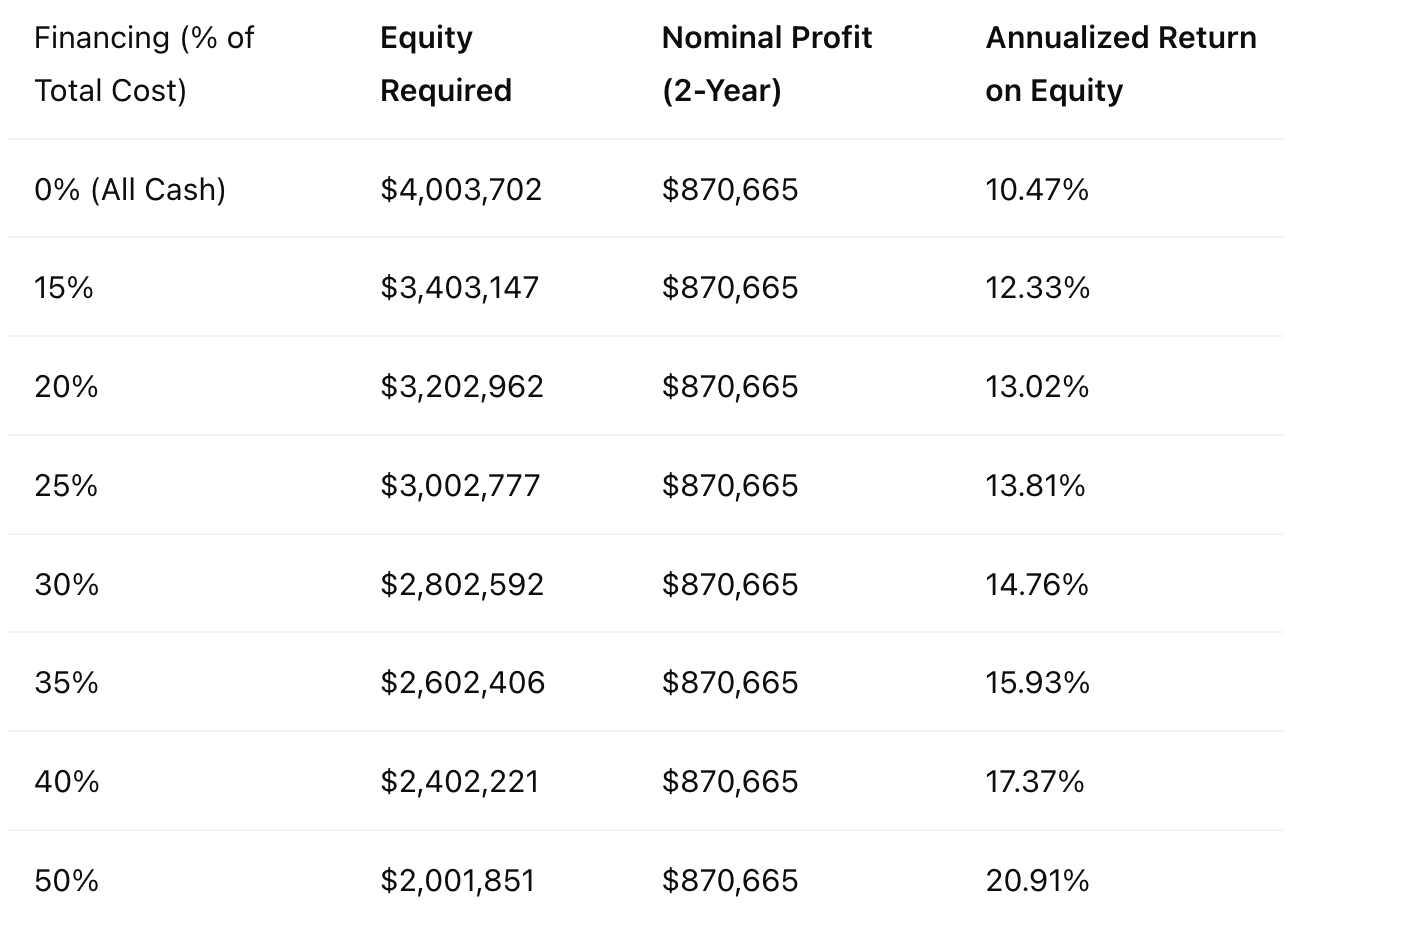
Notes: Two‑year horizon; simplified view (no draw schedule, points, or interest). Leverage amplifies the apparent ROE but doesn’t make the house worth more or the buyer pay more. It also amplifies risk if prices, timelines, or costs slip.
This 25% nominal return scenario is the cowboy’s comfort zone — the sweet spot for the hands-on investor who wants to maybe manage crews and be part of the process. This cowboy is certainly anyone that wants to keep the home and do better than just a retail purchase.
This return is well high enough for many to justify the risk but still within reach of realistic execution. The cowboy bets on speed, cost control, and optimism — believing the skill of the builder and the quality of the design, timing, and relationships that can convert a good project into a great one.
The cowboy loves this table. The investor studies it carefully. The difference? The cowboy mistakes optical leverage gains for skill. The investor recognizes that debt multiplies both upside and risk. If the market wobbles, the cowboy’s double‑digit annualized return can turn into a negative equity position almost overnight.
True professionals respect leverage, but they don’t worship it. But What If?
When the Cowboy Is His Own Sheriff
Now, let’s take the same scenario and adjust one key element — the cowboy is also his own sheriff. In this case, he’s not paying a general contractor or builder fee. That fee, which averaged roughly $295,000 in the prior example, now stays in his pocket.
That adjustment raises the nominal profit from $870,665 to $1,165,665. With the same total project cost of $4,003,702, the all‑cash return increases from 10.47% to 13.90% over two years, before even considering any leverage.
Here’s how that shift looks when we reapply the same financing ratios:
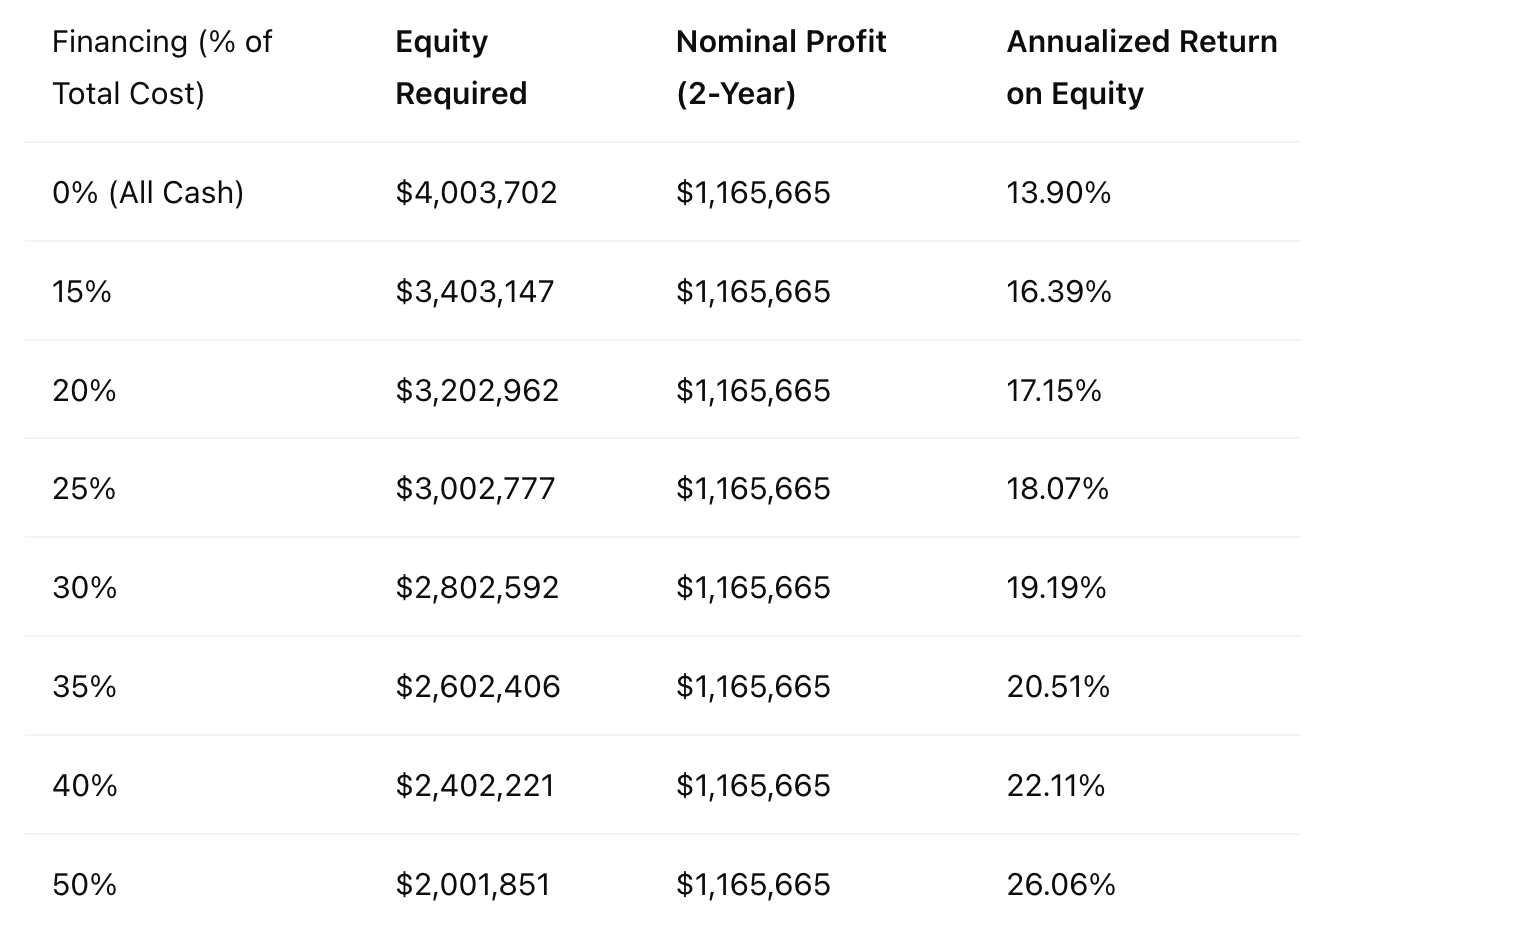
This is the builder-developer archetype — the true cowboy who not only takes the risk but controls the execution. By removing the builder fee, he effectively captures both margins: the construction spread and the ownership return. The danger, of course, is that his time, overhead, and opportunity cost are now fully embedded in the deal. It’s higher reward, but also higher exposure if the project slows or costs overrun. This is a very good business model for at least two of our main builder clients.
But The Takeaway
When sellers in Old Seagrove hold out for fantasy prices based on what their neighbor “heard” a home sold for or a lot is worth, they ignore what actually drives profitability. The market doesn’t care what someone thinks their lot is worth or the home that is clearly out of step with the obvious on coming future..
It cares what the end buyer will pay for a finished, furnished, turn-key home — and whether there’s enough room in between for the next investor or builder to make a rational return.
We measure our work by that simple reality — the math doesn’t lie. We also measure our work by knowing our integrity is high even when the critics come, because in all of this 70% of the people buying the homes we work on with our teams together are not using those homes as rental properties. That is our real mission. Great homes and Great People to create the neighborhood that everyone thinks they want, but that we are building.