
Valuing Real Estate Using Reality
Economics and Statistics Drive Values (plus some subjectivity)

Interest Rates vs. Prices: A Reality Check on Home Affordability
For those stuck in homes where the market to sell them does depend on interest rates, optimism for a small move in rates is only going to catch a marginal sale or two. It won’t change the underlying dislocation in the “I need financing to buy this home” market.
Since 2019, U.S. home values have exploded. National price indices show that house prices jumped more than 50 percent between 2019 and late 2024—roughly a decade’s worth of typical appreciation packed into just five years. In the same span, median household income climbed only about 17 percent. Mortgage rates, meanwhile, swung from the low‑3 percent range to pandemic lows around 2.7 percent and then up to about 6.5 percent in 2025.
Many real‑estate professionals celebrate every dip in rates as though affordability has been solved. But when prices run far ahead of incomes, small rate changes barely dent the monthly payment. The arithmetic below explains why.
A simple comparison
In 2019 a home priced at $687,000 with a 20 percent down payment and a 30‑year mortgage at 3.25 percent carried a principal‑and‑interest payment of about $2,392 per month. Fast‑forward to 2025: the same house sells for $1,100,000, the rate is 6.5 percent, and the monthly payment jumps to roughly $5,562. That’s a 132 percent increase in payment for the same house—reflecting both the higher price and the higher rate.
Can rates fix this?
Even if you could cut the 2025 rate to 5.5 percent, the payment on a $1.1 million home with 20 percent down would still be around $4,997. In a fantasy world of 0 percent mortgages, the payment would be a bit over $2,440—still higher than the 2019 baseline. In other words, minor rate relief can’t make a $1.1 million purchase feel like a $687,000 one.
To match the 2019 payment at the 2025 rate, the home price would have to fall to roughly $473,000 (again assuming 20 percent down). And if you adjust that figure upward by the same income growth households have enjoyed since 2019, you land around $599,000. In other words, a $599 k home in 2025 at a 6.5 percent mortgage produces a payment similar to a $687 k home in 2019 at 3.25 percent once you account for income gains. That’s the “new normal” for buyers seeking 2019‑style monthly payments.
But Truth Matters. Who you work with matters. Learn more about our work.
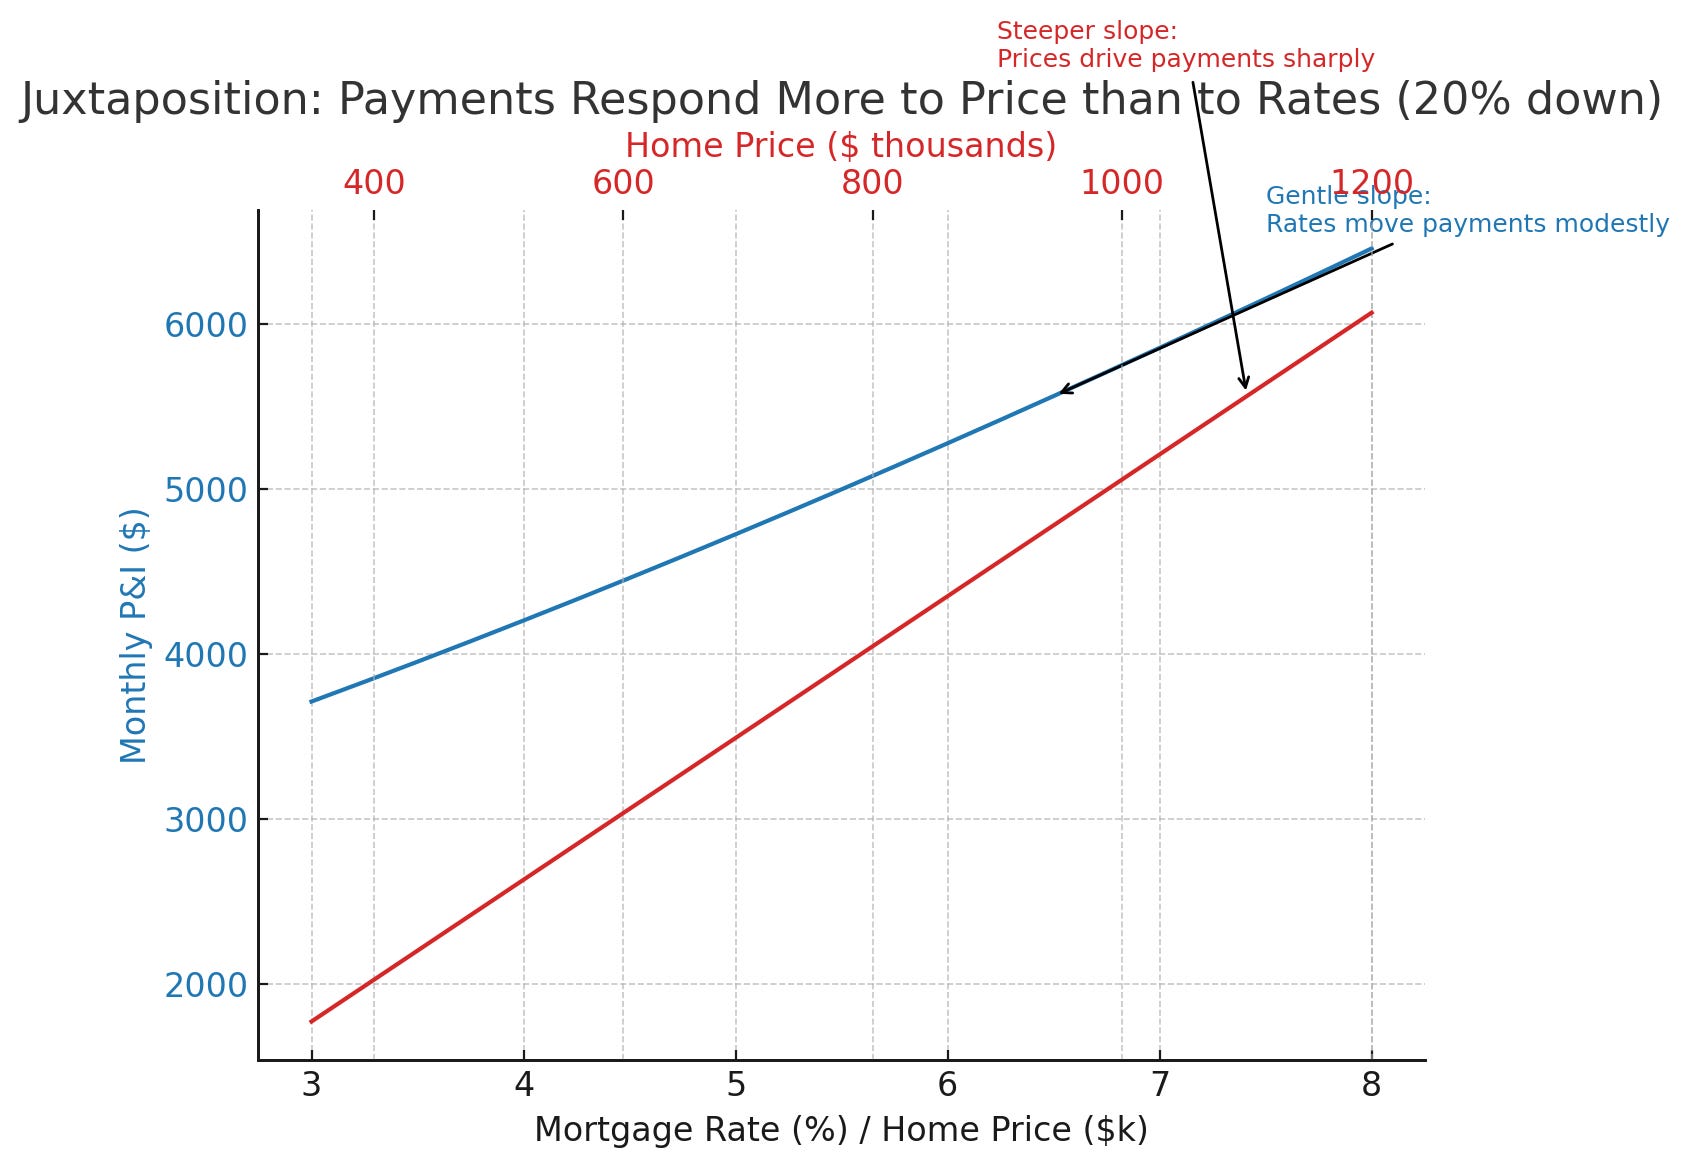
Prices vs. rates: a visual contrast
It helps to visualize how payments react to price versus rate. When we chart payments for a $1.1 million home across different mortgage rates, the line slopes gently downward; a full percentage‑point drop might save only a few hundred dollars a month. By contrast, plotting payments at a fixed rate across a range of home prices produces a much steeper line. Each $100 k change in price moves the payment by roughly $500 per month. Once rates are in the mid‑single digits, payments are far more sensitive to price than to rate.
What the data tell us
Prices have outpaced incomes. Over the last five years, national house prices rose by more than 50 percent, while median household income increased by less than 20 percent. Even after adjusting for inflation, the pandemic‑era boom represents unprecedented real growth in home values.
Small rate cuts are cosmetic. A quarter‑percentage‑point drop trims the payment on a $1.1 million home by about $144 per month—equivalent to chopping roughly $28,500 off the sale price. Nice, but not transformative.
Affordability is fundamentally about price versus income. To make 2025 buyers feel like it’s 2019 again, the affordability anchor sits around $600 k, not $1.1 million. That figure isn’t meant to be prescriptive, but it underscores how far price levels have drifted from incomes.
Sellers Feelings
For many sellers, today’s prices feel justified. They’ve watched home values soar and have often invested in their properties along the way. But buyers are doing a different calculation: they care about the monthly payment, not the seller’s purchase history or sunk costs. A home priced far above the income‑adjusted affordability anchor will see slower foot traffic and more negotiating.
Good listing agents can be honest without being antagonistic:
Explain the payment gap. Show how the asking price translates into a monthly payment at current rates. It’s easier to understand why buyers balk when you see that doubling the price more than doubles the payment.
Recognize seller equity. Celebrate the equity gains sellers have enjoyed since 2019, while gently noting that market momentum has cooled.
Position price strategically. Pricing closer to the payment‑anchored range can attract more qualified buyers and shorten time on market. Overpricing and waiting for rate cuts is riskier.
Affordability isn’t just about mortgage rates. It’s about price, income, and expectations. Modest rate relief can’t bridge the gap created by double‑digit price appreciation. Aligning your listing strategy with buyers’ payment capacity is the best way to honor both your sellers’ objectives and market reality.